
Track events and data streams across your organisation
Please note metrics has been updated. Learn more here.
Metrics can be used to track anything from across your organisation. You can then associate metrics to risks to create Key Risk Indicators or KRIs, and report on these using the Reporting Module. Note that Metrics is only available to those on the Risk and Compliance license.
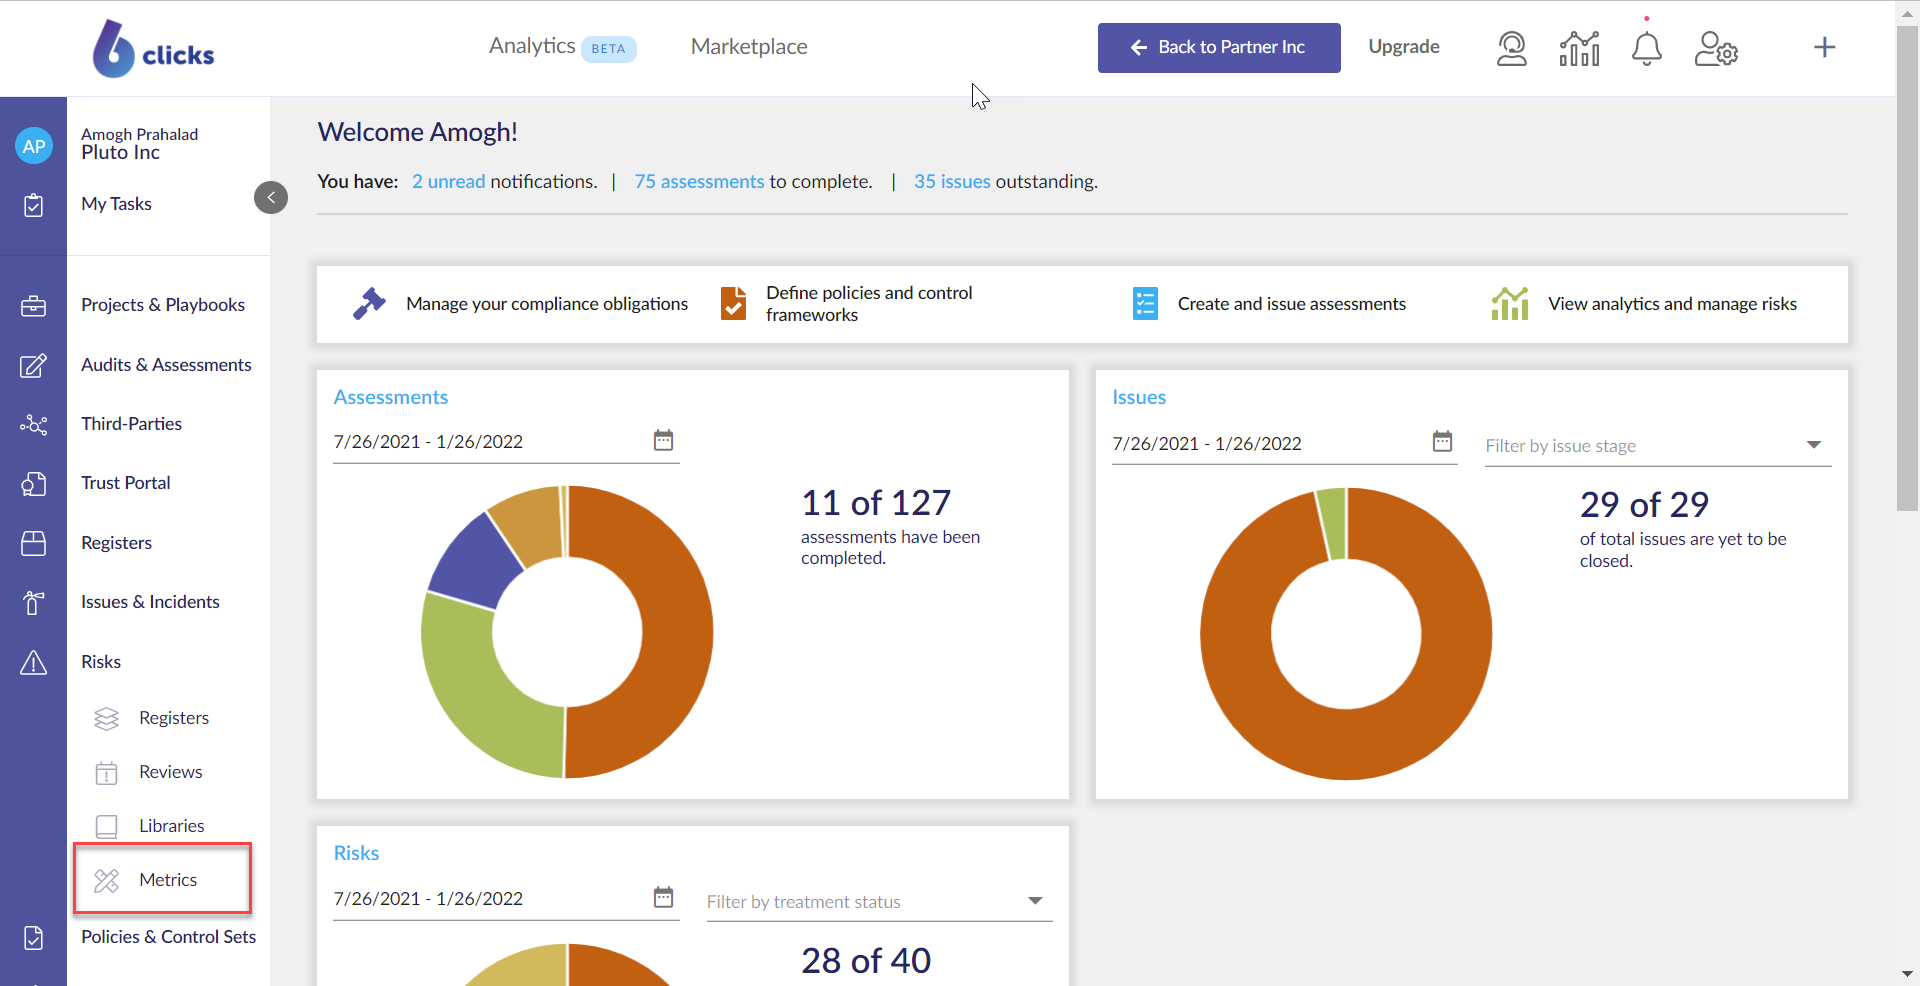
To create a Metric. Head to the Metrics module which can be accessed in the left side panel under Risks.
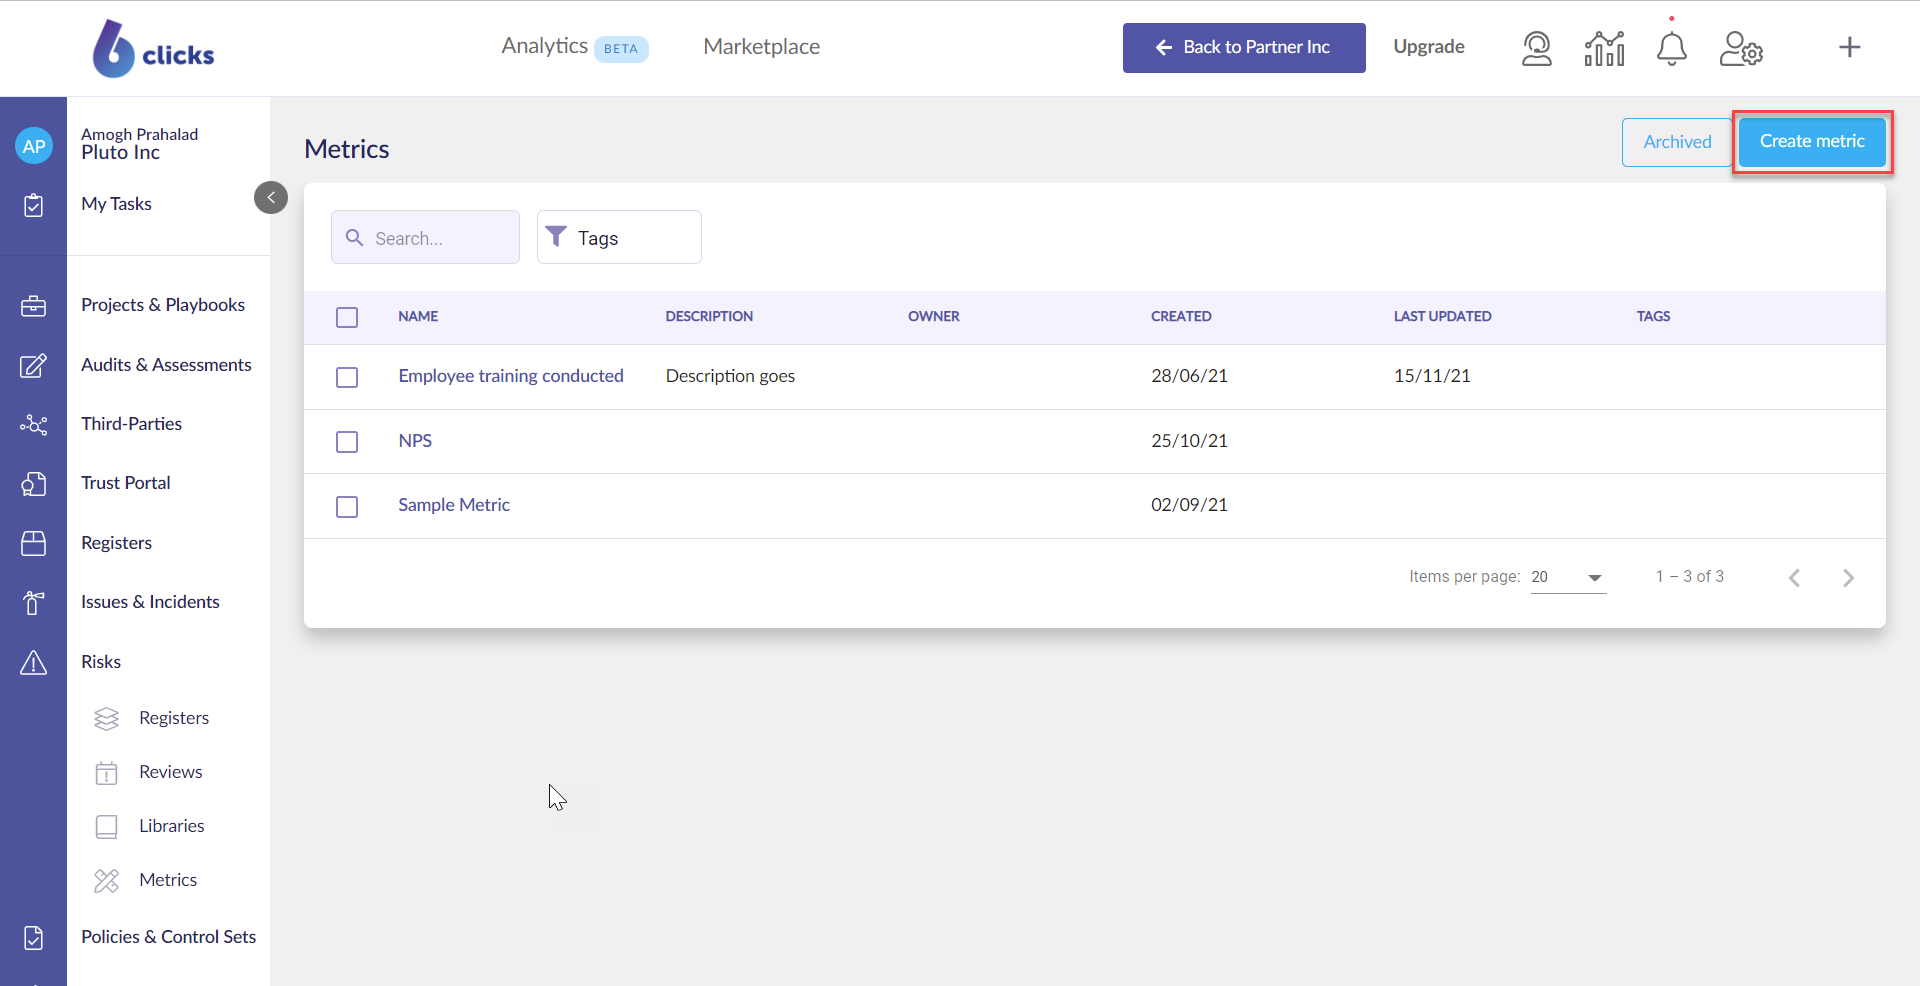
Next hit the Create Metric button.
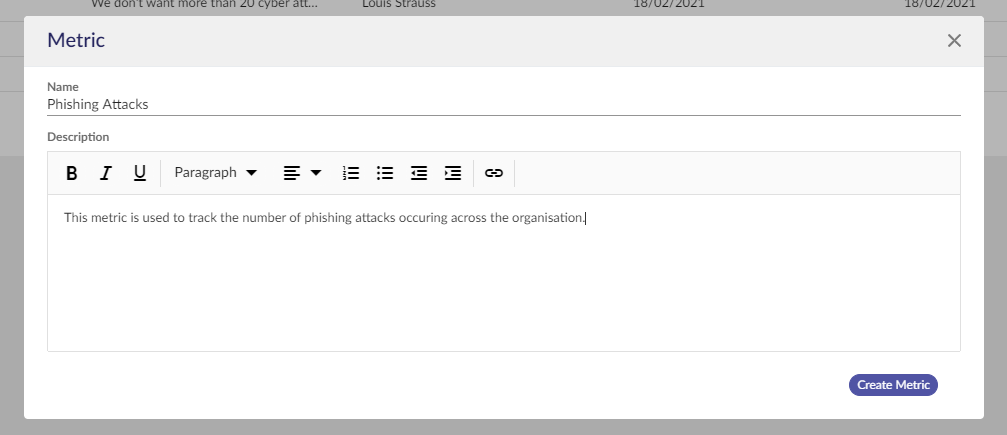
Enter in the name of the metric and add a description. The description can be used to explain the metric and related appetite/thresholds of the metric. Once done, hit Create Metric.
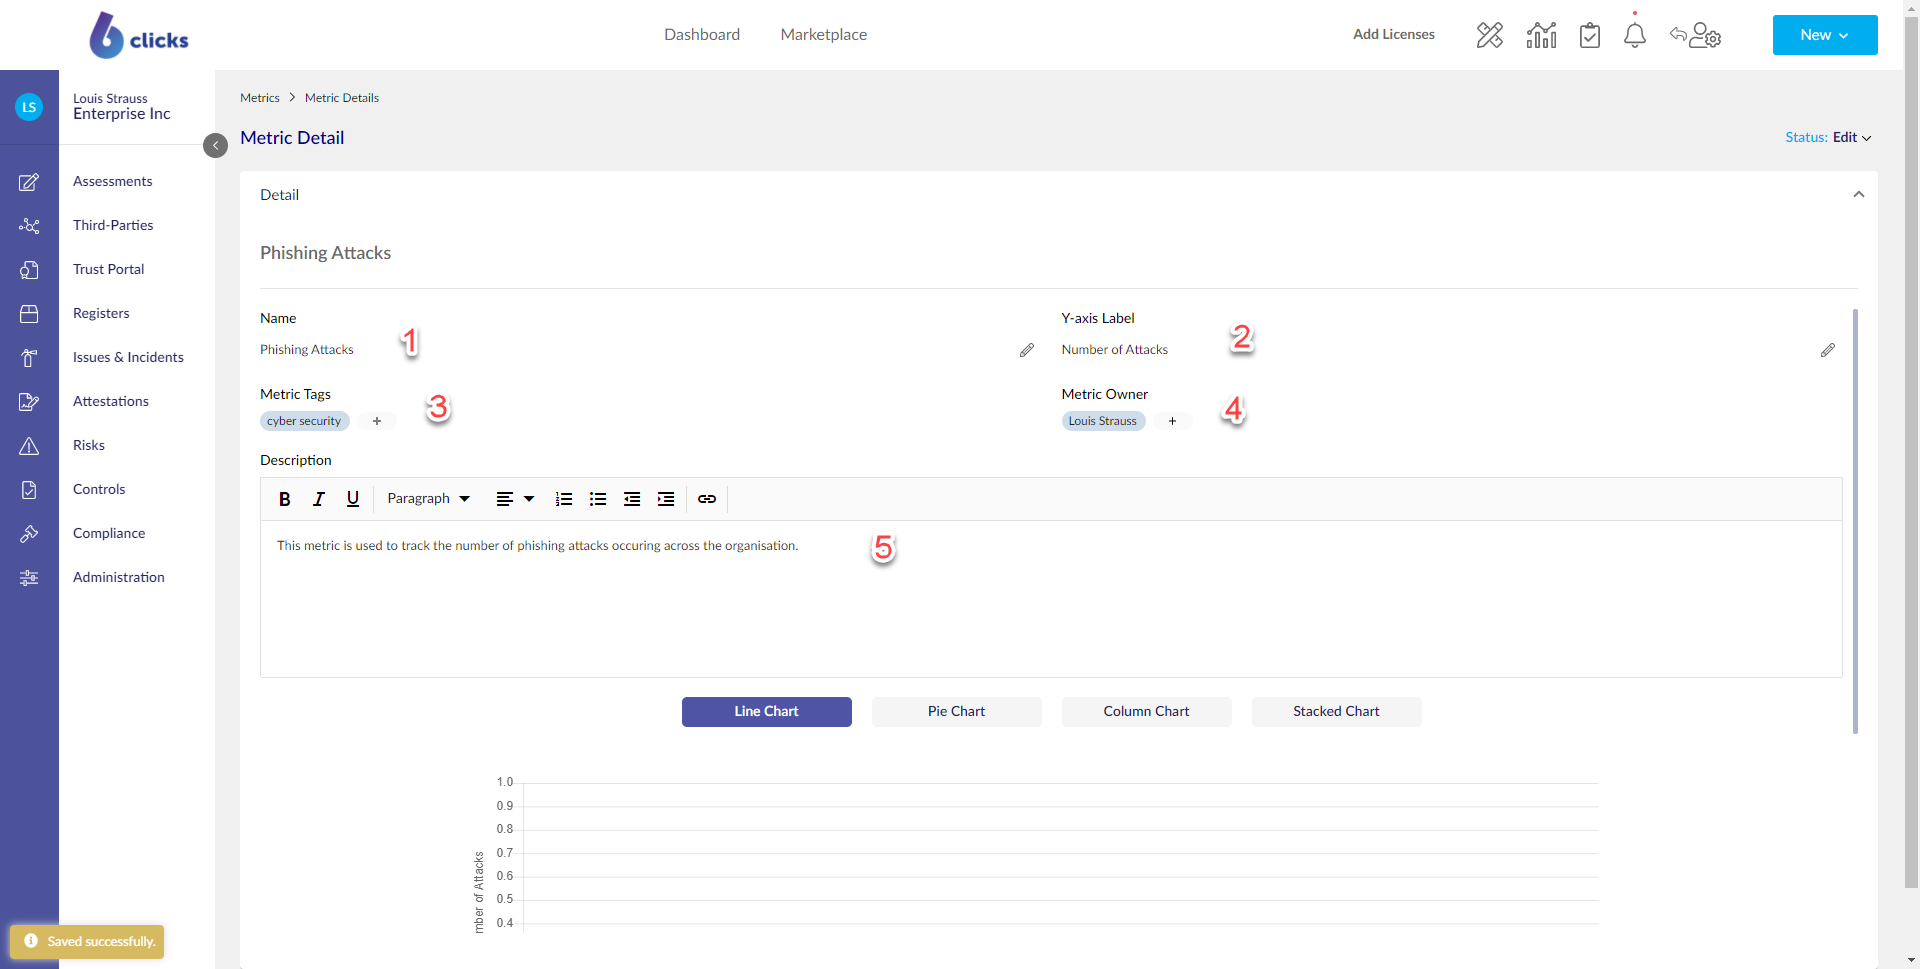
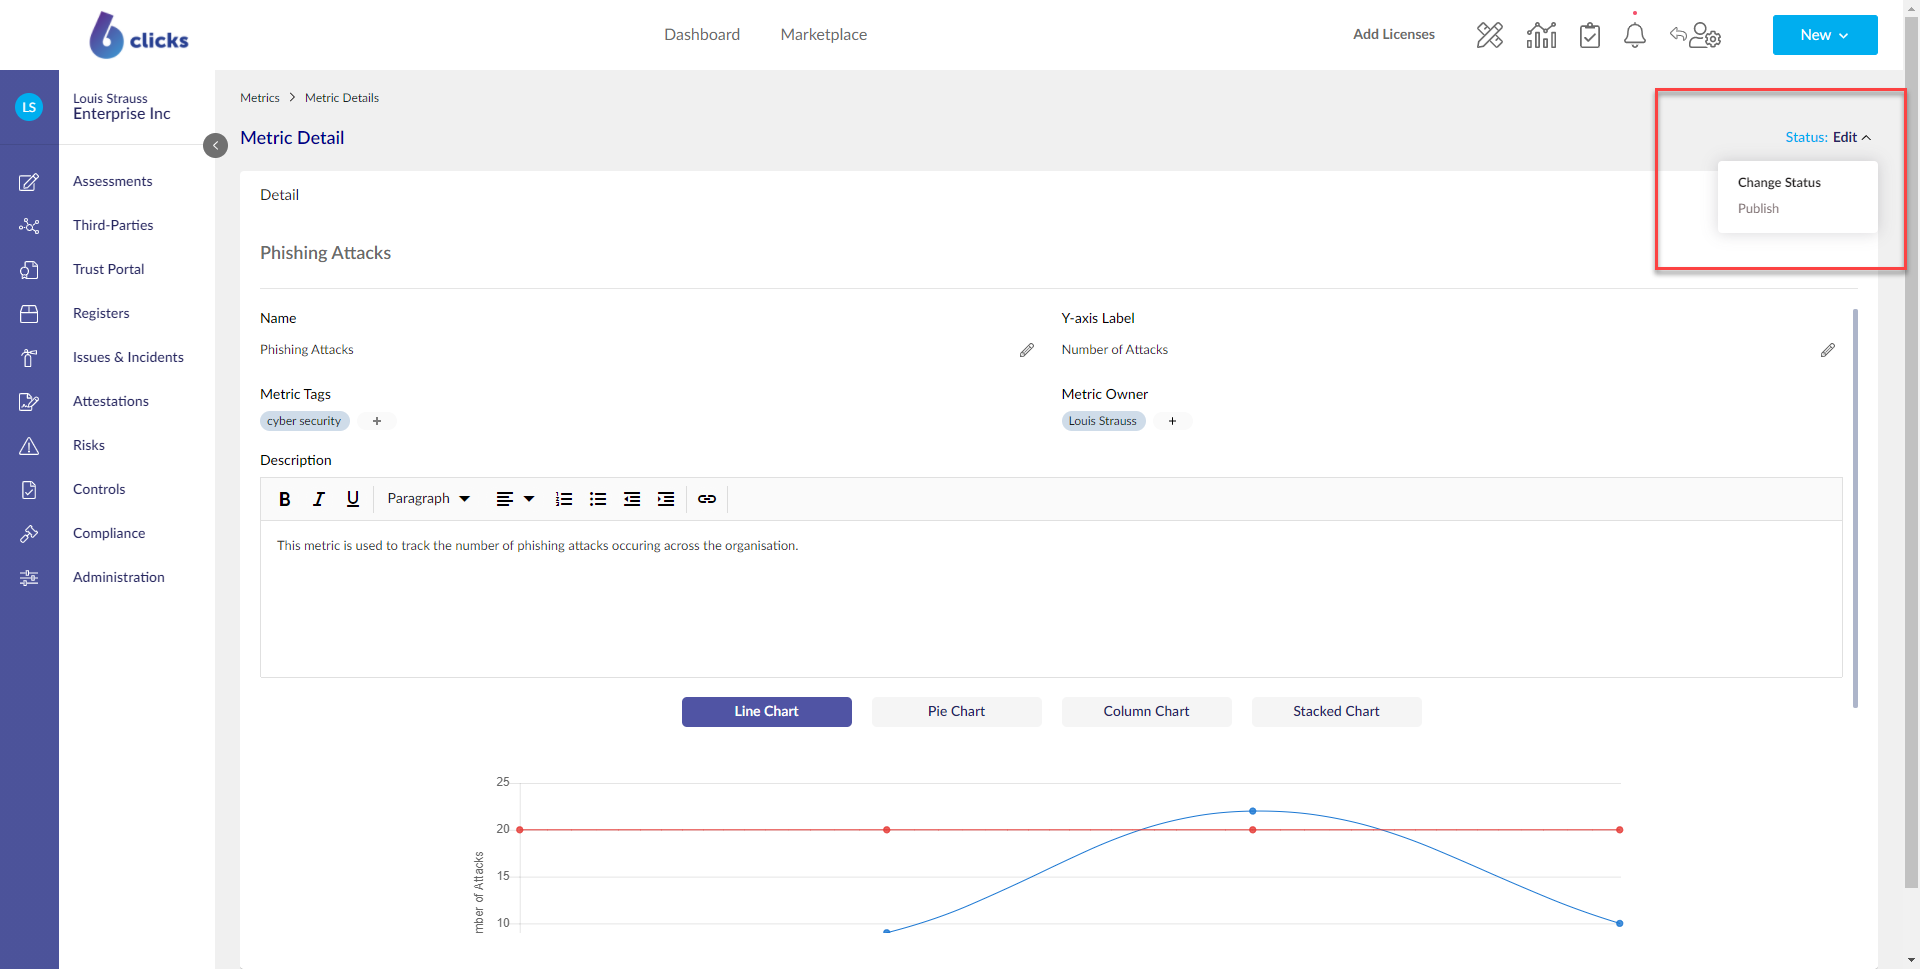
Once you have created the metric you will be taken to the metric details screen. Here you can update the name of the metric (1), define the Y-axis of the metric chart (2), add tags and set (3) and owner (4), as well as add/edit the description (5). The description can be used to add context around the metric, define your tolerance/appetite, as well as provide updates.
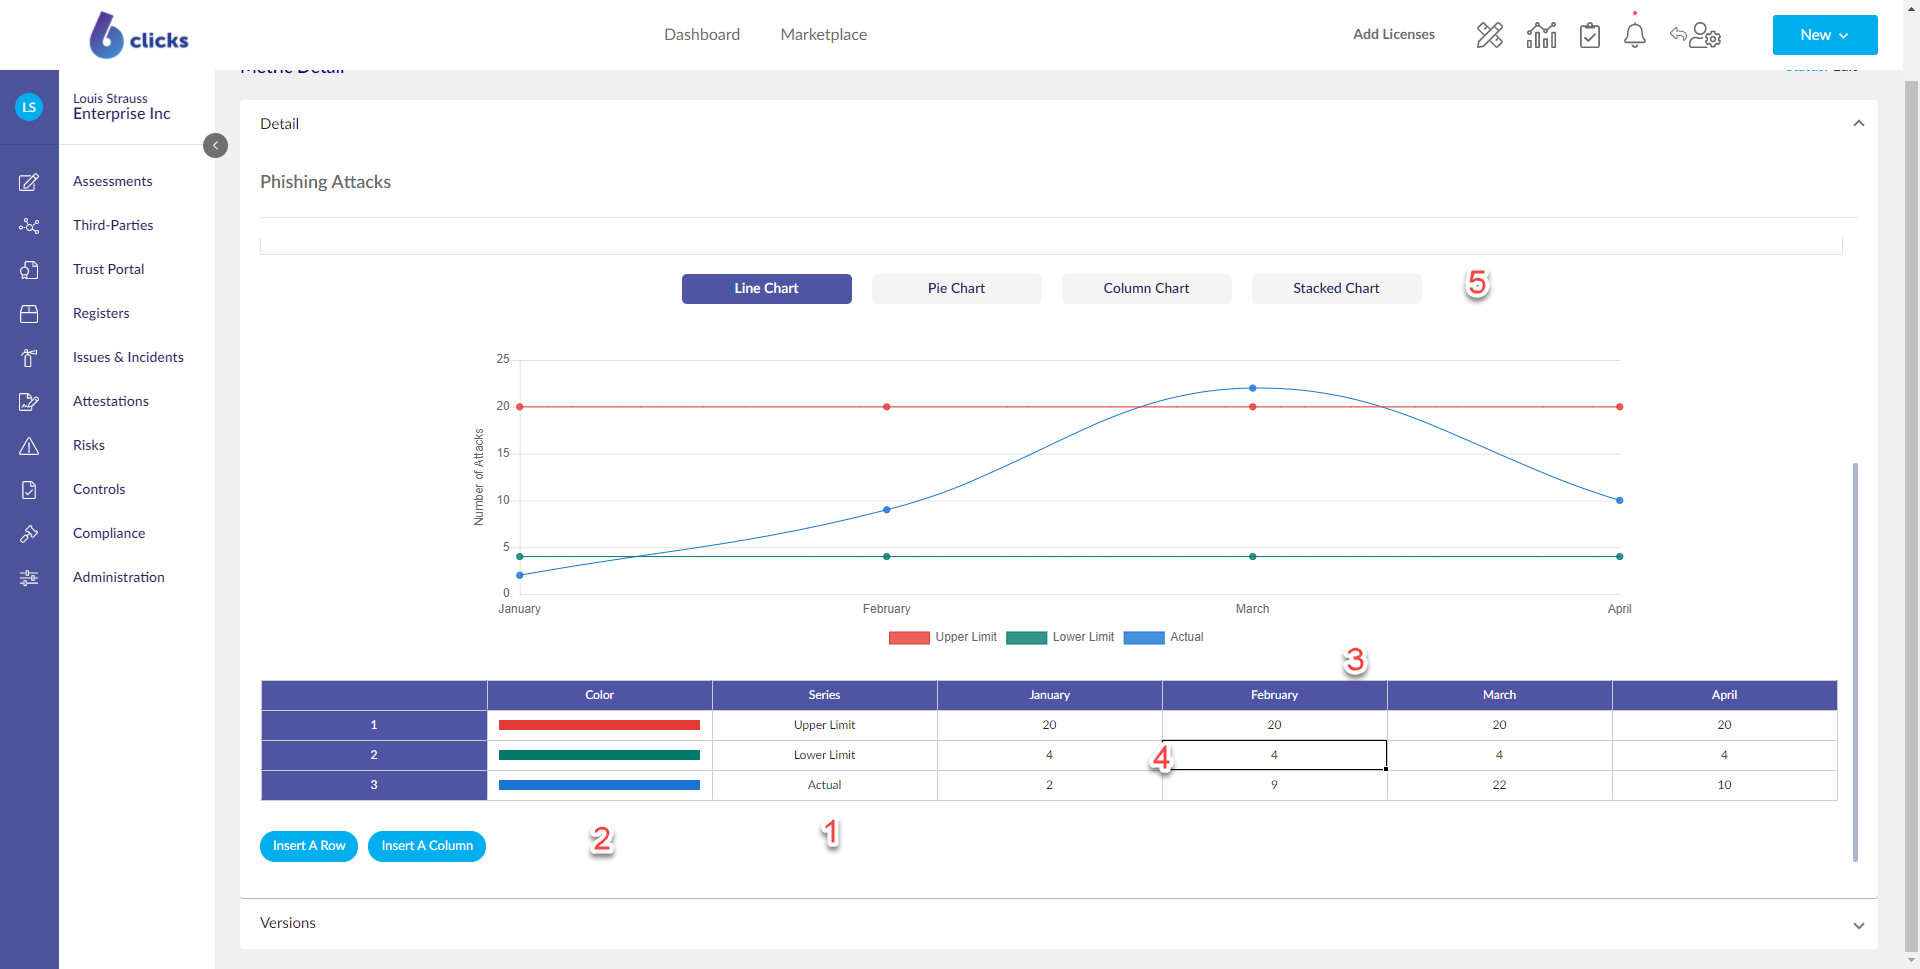
The next step is to define your chart. To do this, add the necessary rows and columns to the table. Each row represents a series to be plotted on the chart, while each column is a data point for each of the series.
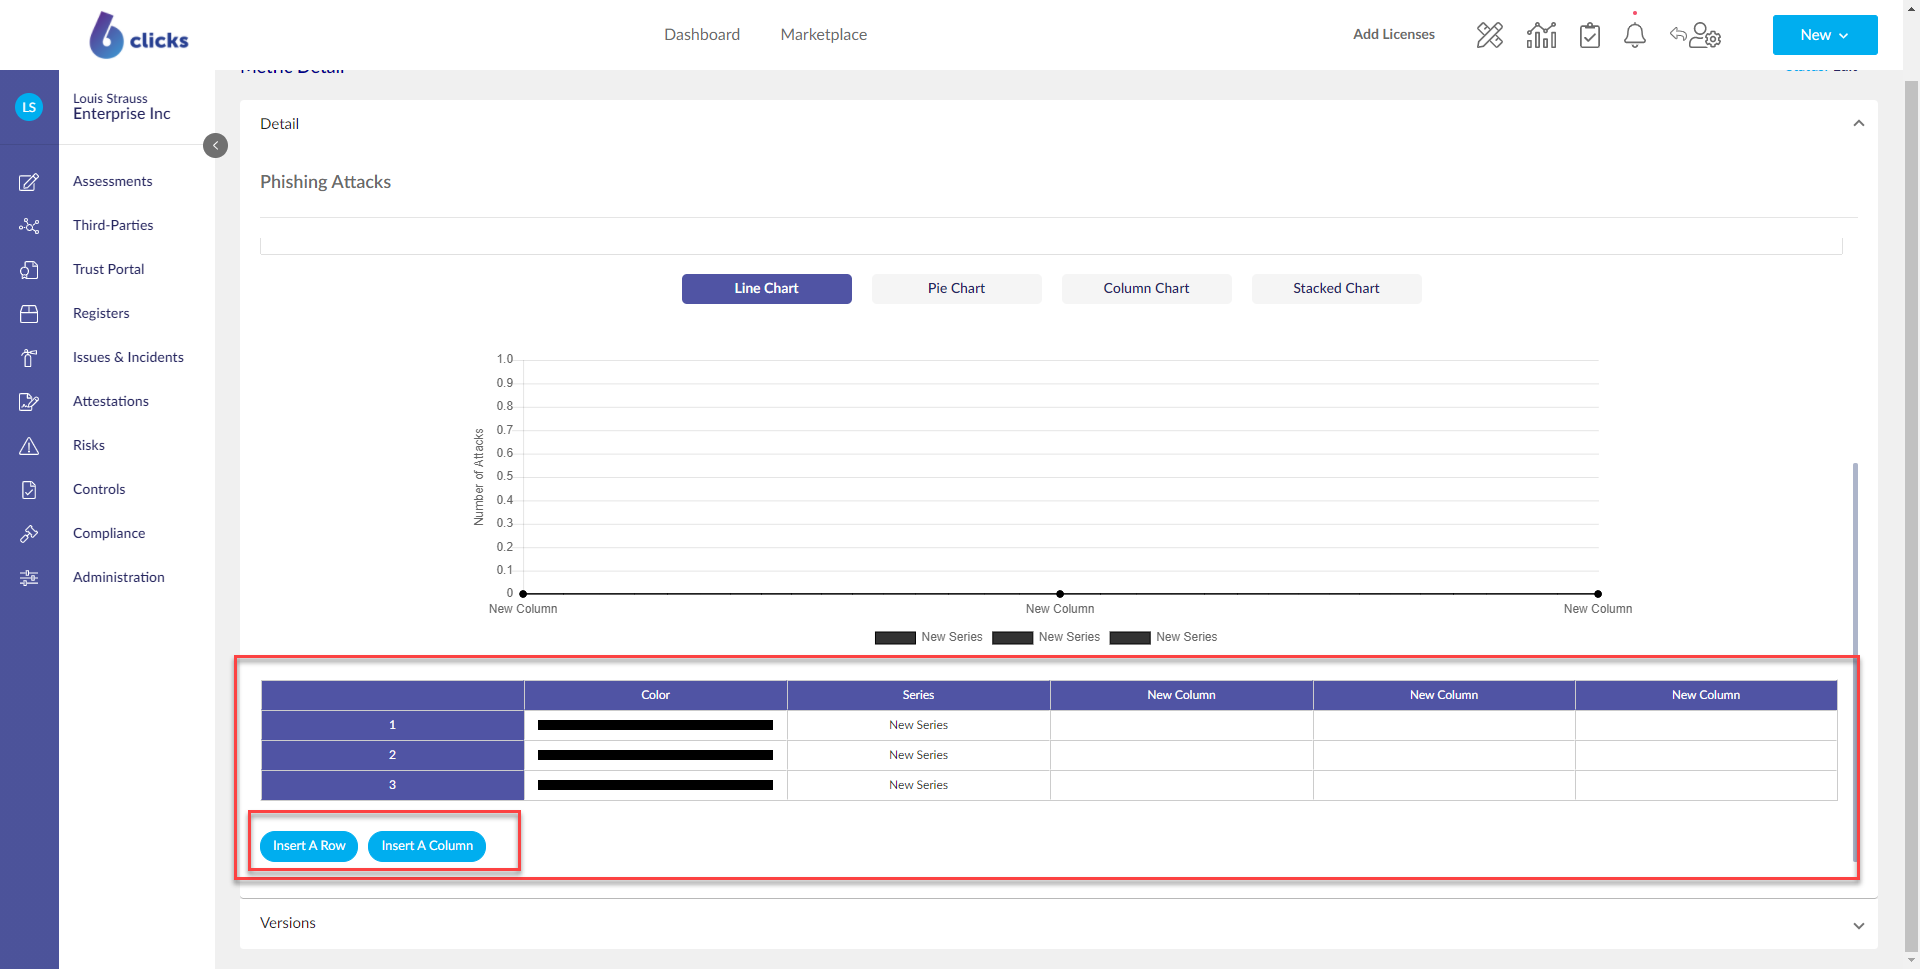
Next:
- Name the series you want to plot on the chart by double-clicking the name of each series
- Set the colours of each series by double-clicking the colour cells
- Update the column names to define the X-axis values by selecting the column name and then right-clicking and choosing Rename this column
- Add the values for each series by double-clicking into each cell and typing a number
- Update the chart style to suit your need. Pick from Line Chart, Pie Chart, Column Chart and Stacked Chart
Once you have completed creating the Metric, publish it by changing the status using the top right Status dropdown. You can edit a Metric by changing its status back to Edit.
Each time the status is changed from Edit to Published, a new version is created. You can view and restore old versions from the version section of a Metric.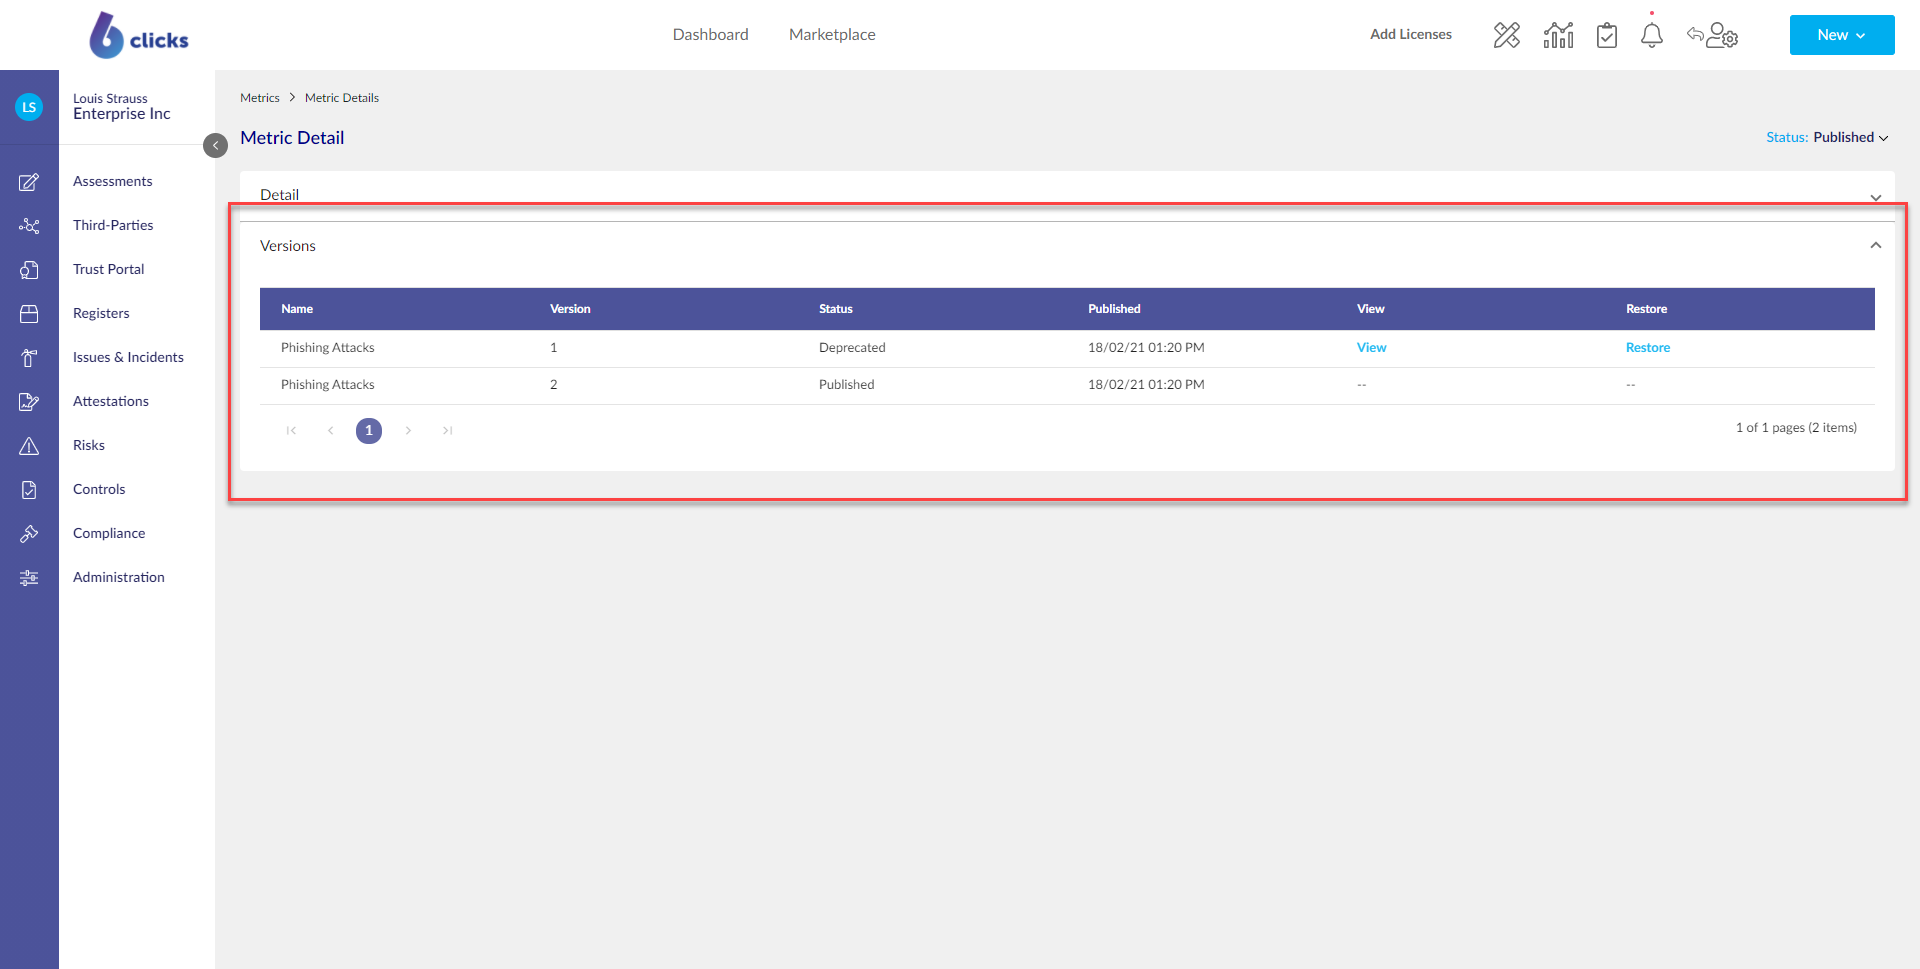
You can define Key Risk Indicators (KRIs) and Risk Appetite by using metrics and assigning them to risks, as well as use the reporting module for metric, KRI and Risk Appetite reporting. To learn more, head here.